×
FAQ
What is a Sankey diagram?
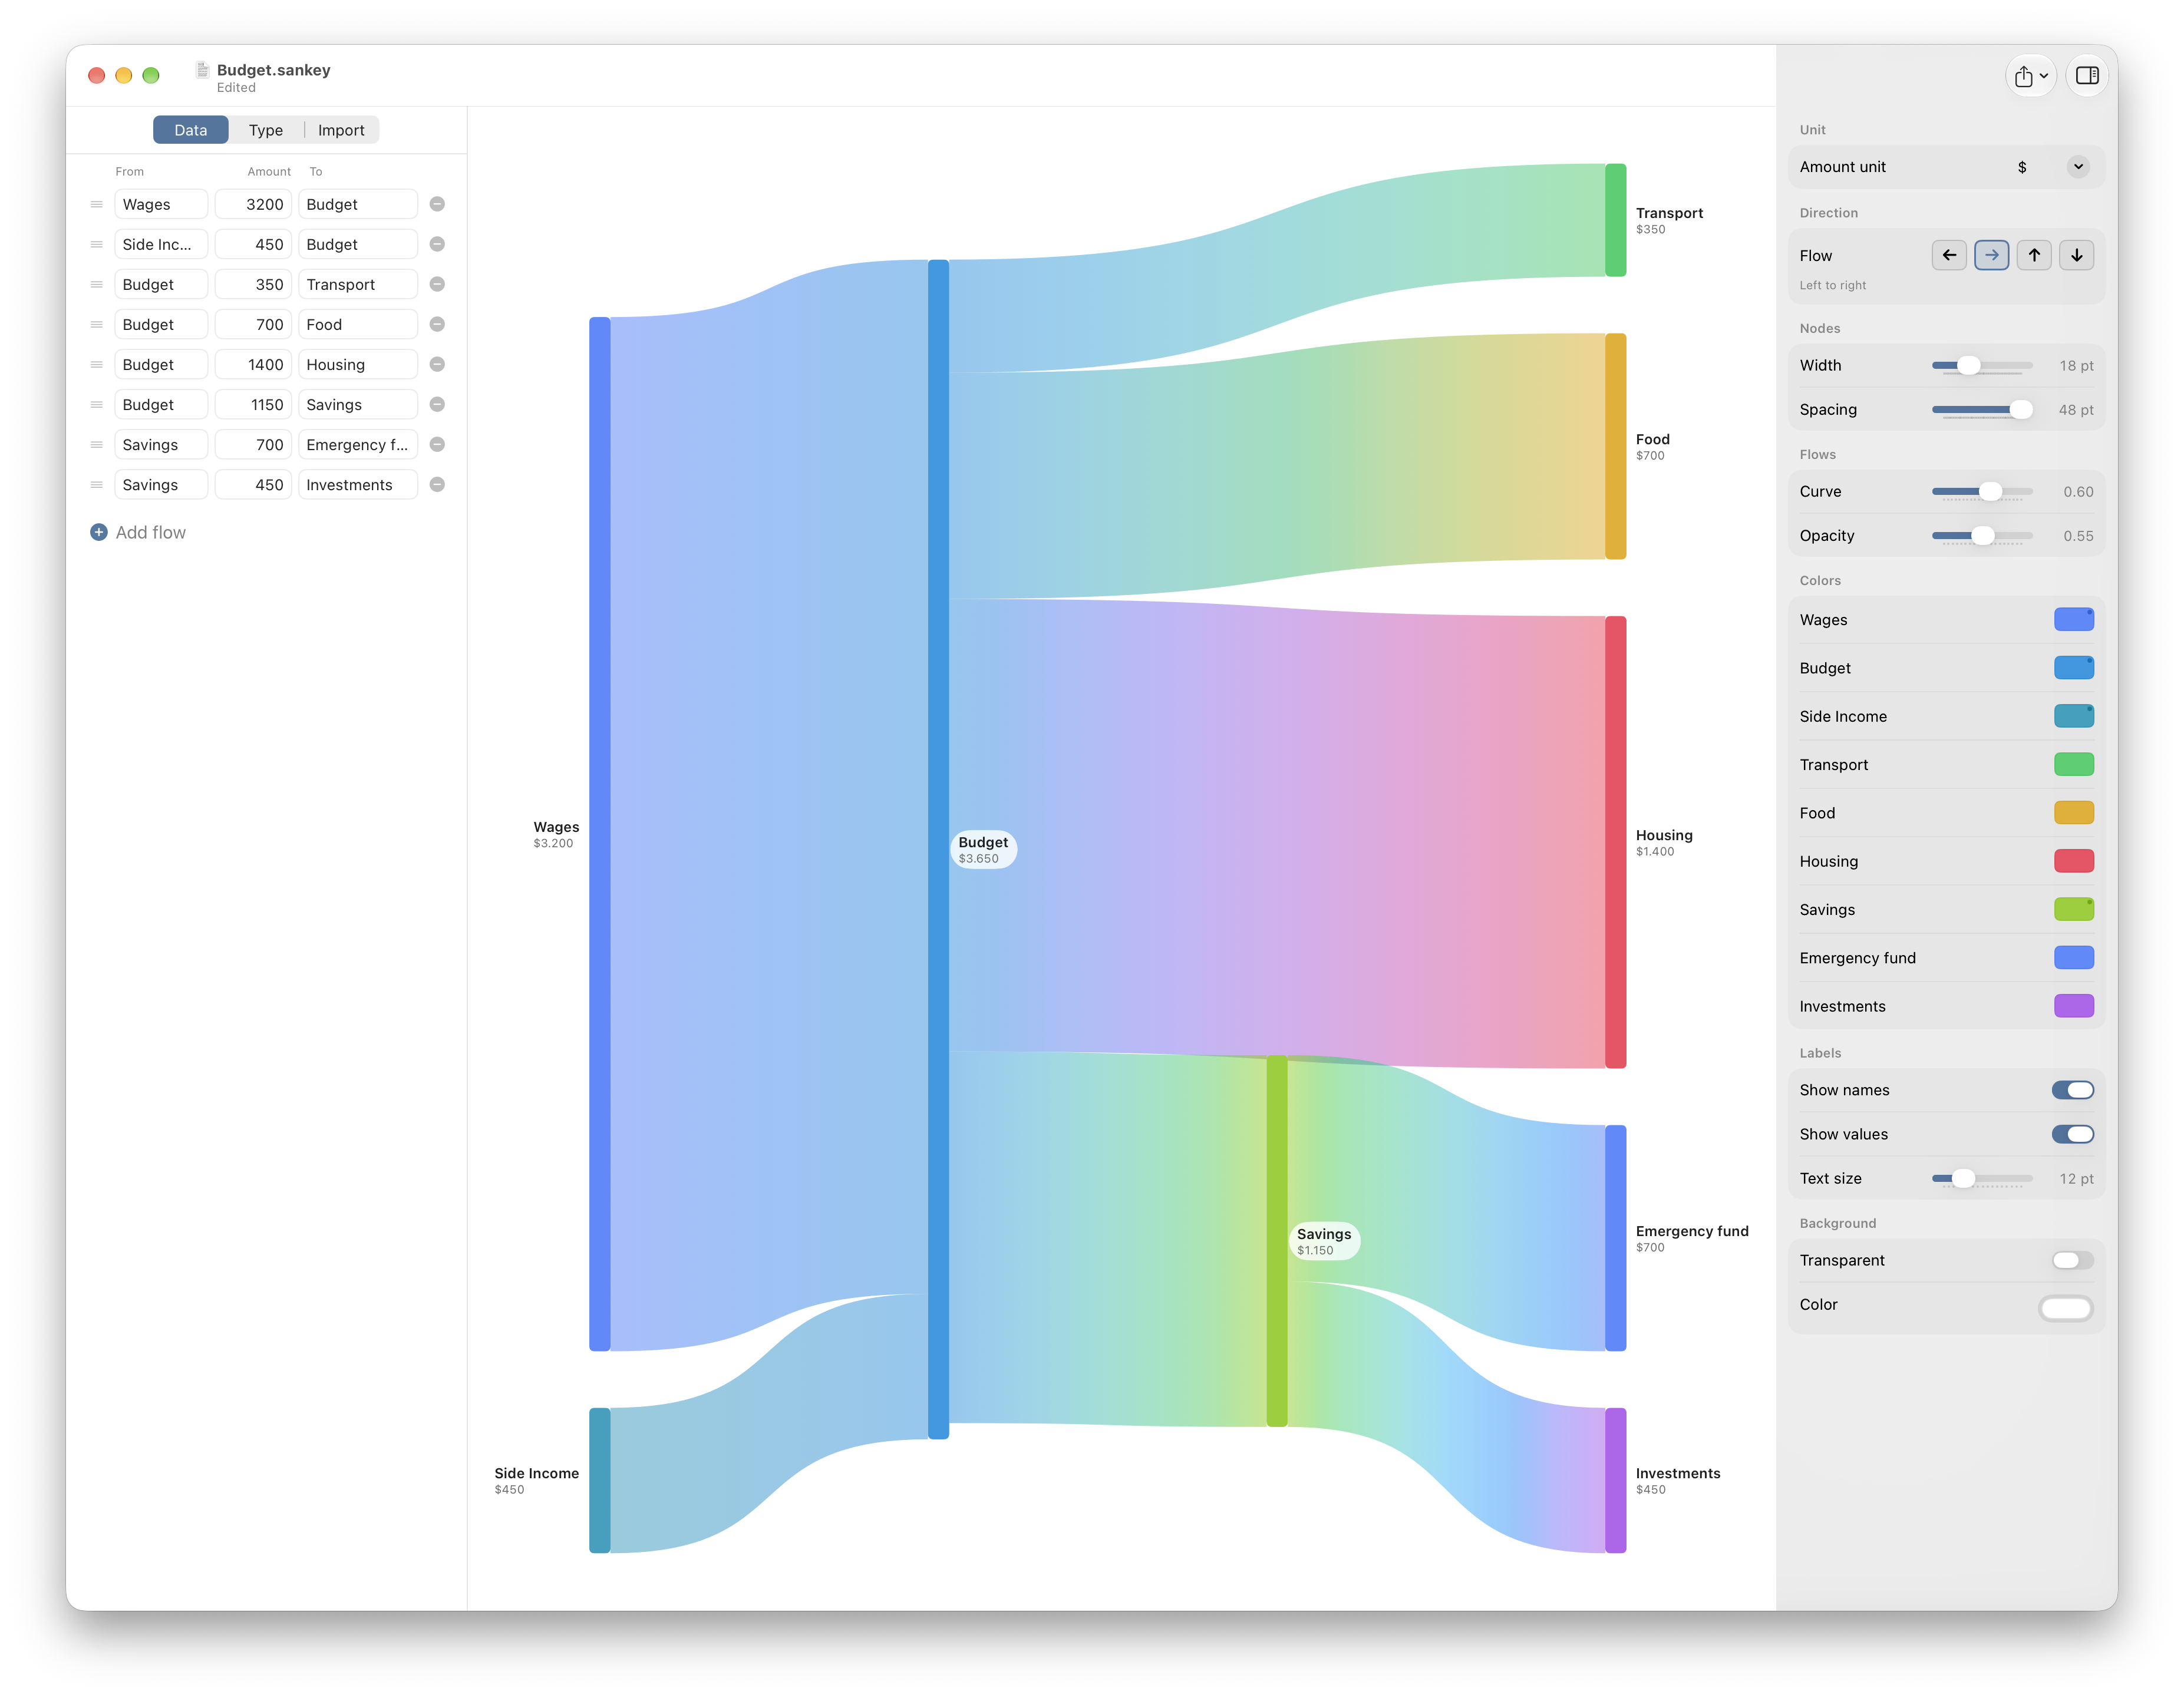
A flow diagram where the width of each ribbon is proportional to the quantity it carries. It's the clearest way to show where a total comes from and where it goes.
How do I build one?
Three ways. Type it, one line per flow: Wages [3000] Budget. Build it visually with a drag-to-reorder list of source, amount, and target — rearranging rows restacks the diagram. Or import a spreadsheet: paste from Excel or Numbers, or open a CSV or XLSX file.
Can I control how it looks?
Yes. Flow direction (left, right, up, or down), node width and spacing, ribbon curve and opacity, per-node colours from a hand-tuned palette, names and values on or off, a unit, and a background — all in the inspector.
What can I export?
PNG, PDF, and SVG. Choose an aspect ratio or an exact pixel size, set a resolution, and add margins, with a live preview. The SVG output is clean and standards-compliant, ready for the web or a vector editor.
Where are my files kept?
SankeyFlow documents are plain-text files with a .sankey extension, saved wherever you choose. No proprietary format, no lock-in.
What does it need?
macOS 26 (Tahoe) or later. See the Mac App Store for current pricing.